Berkshire Hathaway Lags S&P 500 by 12 Points at 2026 Midpoint
Berkshire's B shares are down 1.8% year-to-date, trailing the S&P 500's 10.7% gain by more than 12 percentage points as the year crosses its halfway mark.
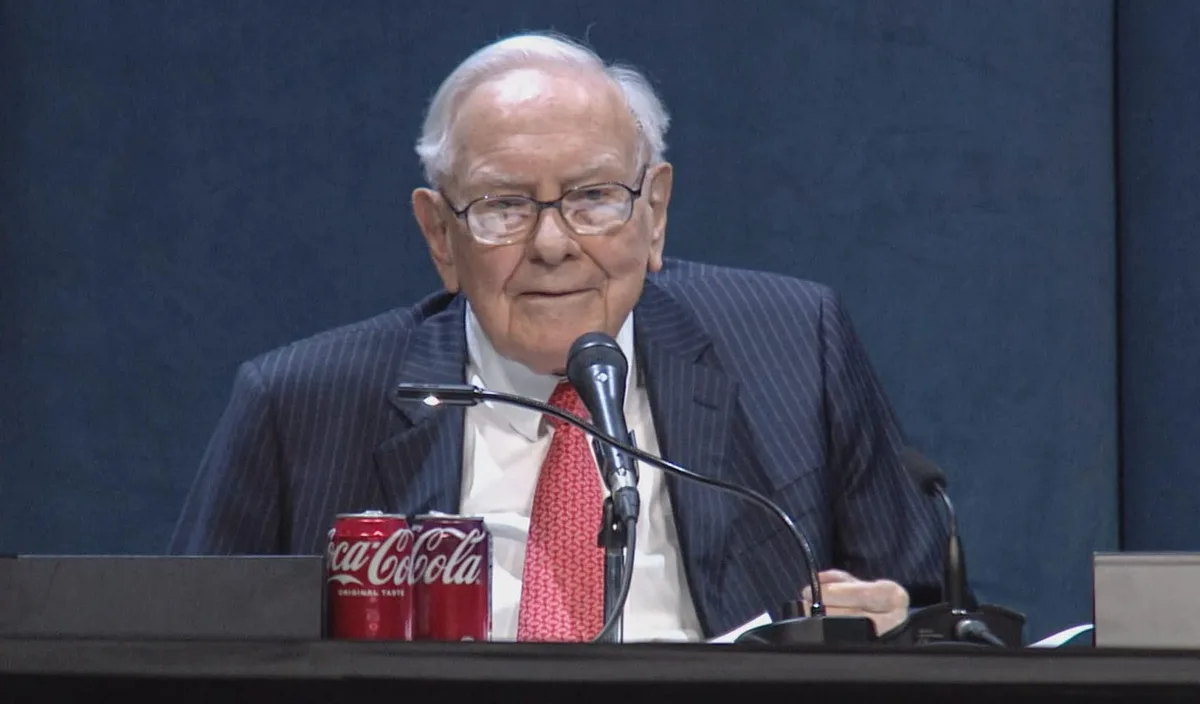
Berkshire Hathaway's Class B shares have slipped 1.8% since January, a modest decline that nonetheless represents a significant gap relative to broader market performance. With 2026 now past its midpoint, the conglomerate finds itself trailing the S&P 500 by roughly 12.4 percentage points — a spread that would have seemed improbable to many investors who have long viewed Berkshire as a market-beating stalwart.
The S&P 500's 10.7% year-to-date advance reflects a market environment that has, so far, rewarded the kinds of growth-oriented and technology-heavy positions that Berkshire historically underweights. Warren Buffett's conglomerate is structured around capital-intensive businesses, insurance operations, and a famously patient cash deployment strategy — attributes that tend to shine during downturns or periods of volatility but can appear sluggish when momentum-driven rallies take hold.
Read more Carl Icahn's 2015 Broadside Against BlackRock and Larry Fink Explained →
The gap is worth watching not because Berkshire is in distress — it is not — but because it illustrates the ongoing tension between value-oriented, diversified holding companies and an index increasingly shaped by a handful of mega-cap technology names. A double-digit underperformance at the halfway point forces a longer-term question: whether the second half of the year will bring the kind of defensive rotation that historically closes such gaps, or whether the current market leadership has enough durability to keep Berkshire in catch-up mode through December.
For long-term Berkshire shareholders, a single-year lag is rarely cause for alarm given the company's multi-decade track record. But for those benchmarking against the S&P 500, the first half of 2026 serves as a timely reminder that even the most storied value enterprises can face extended periods of relative underperformance when market conditions favor a different investing style.
Continue reading at US Top News and Analysis.